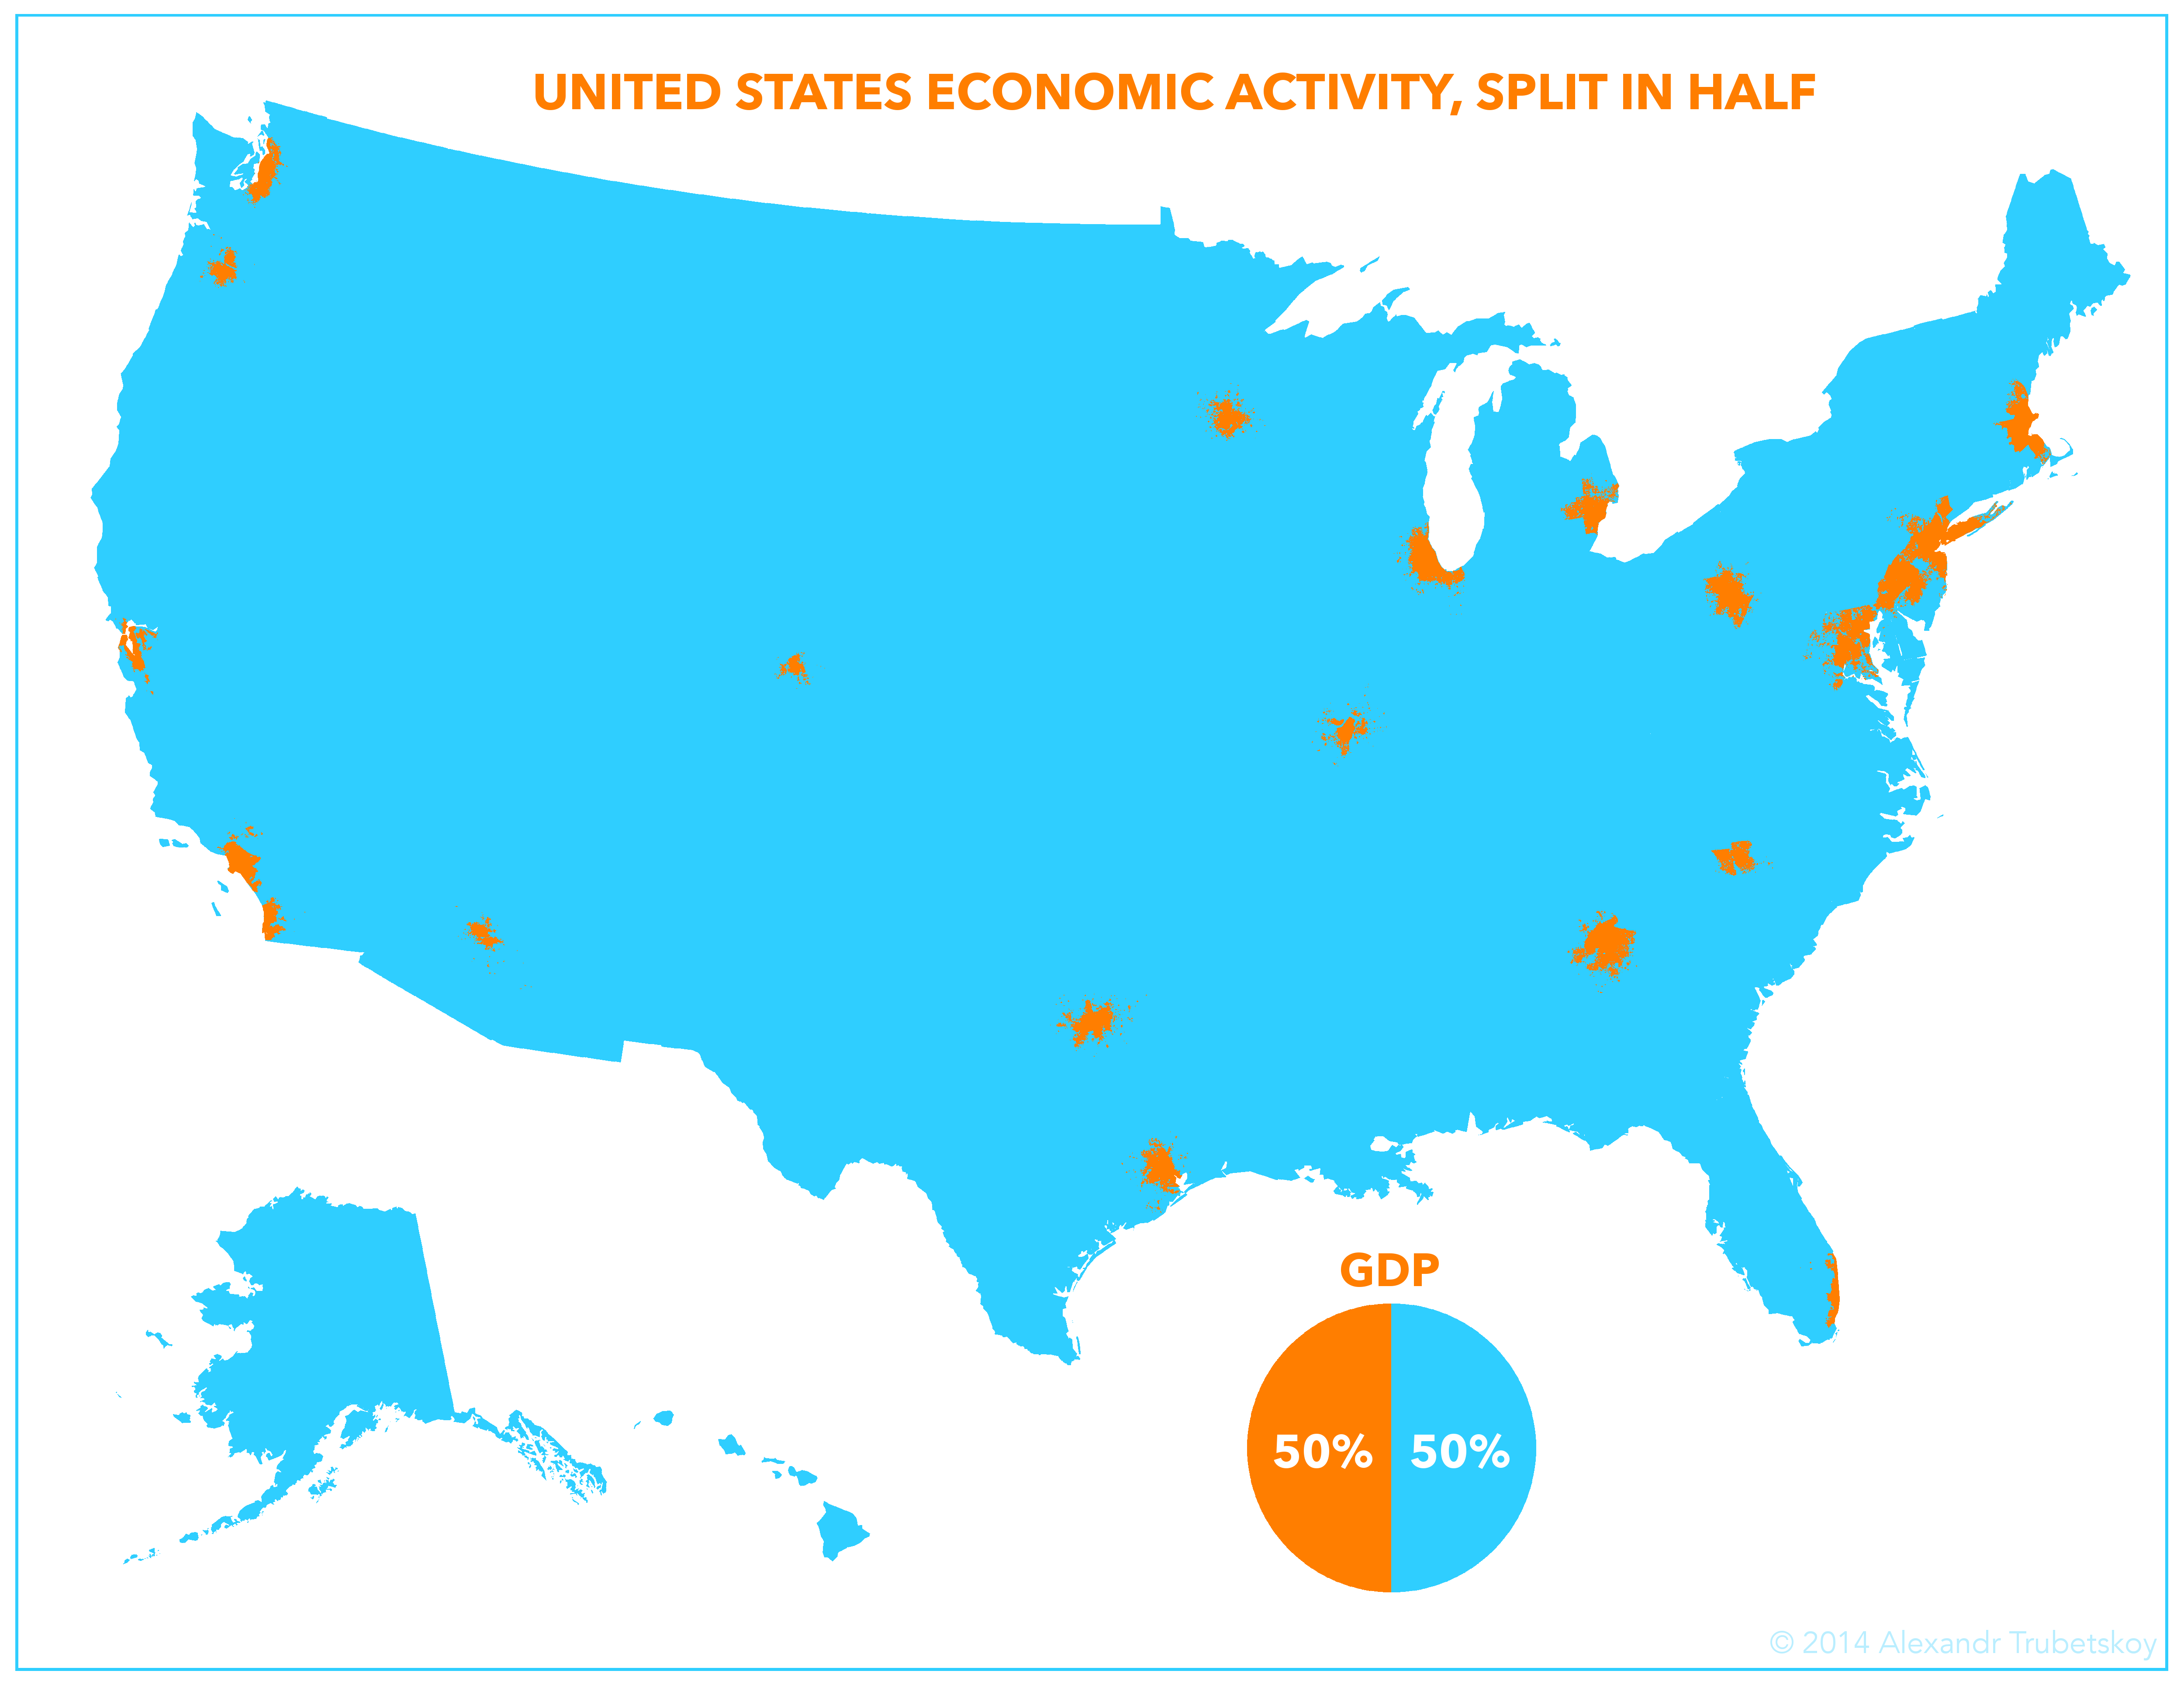
US Economic Activity Split In Half
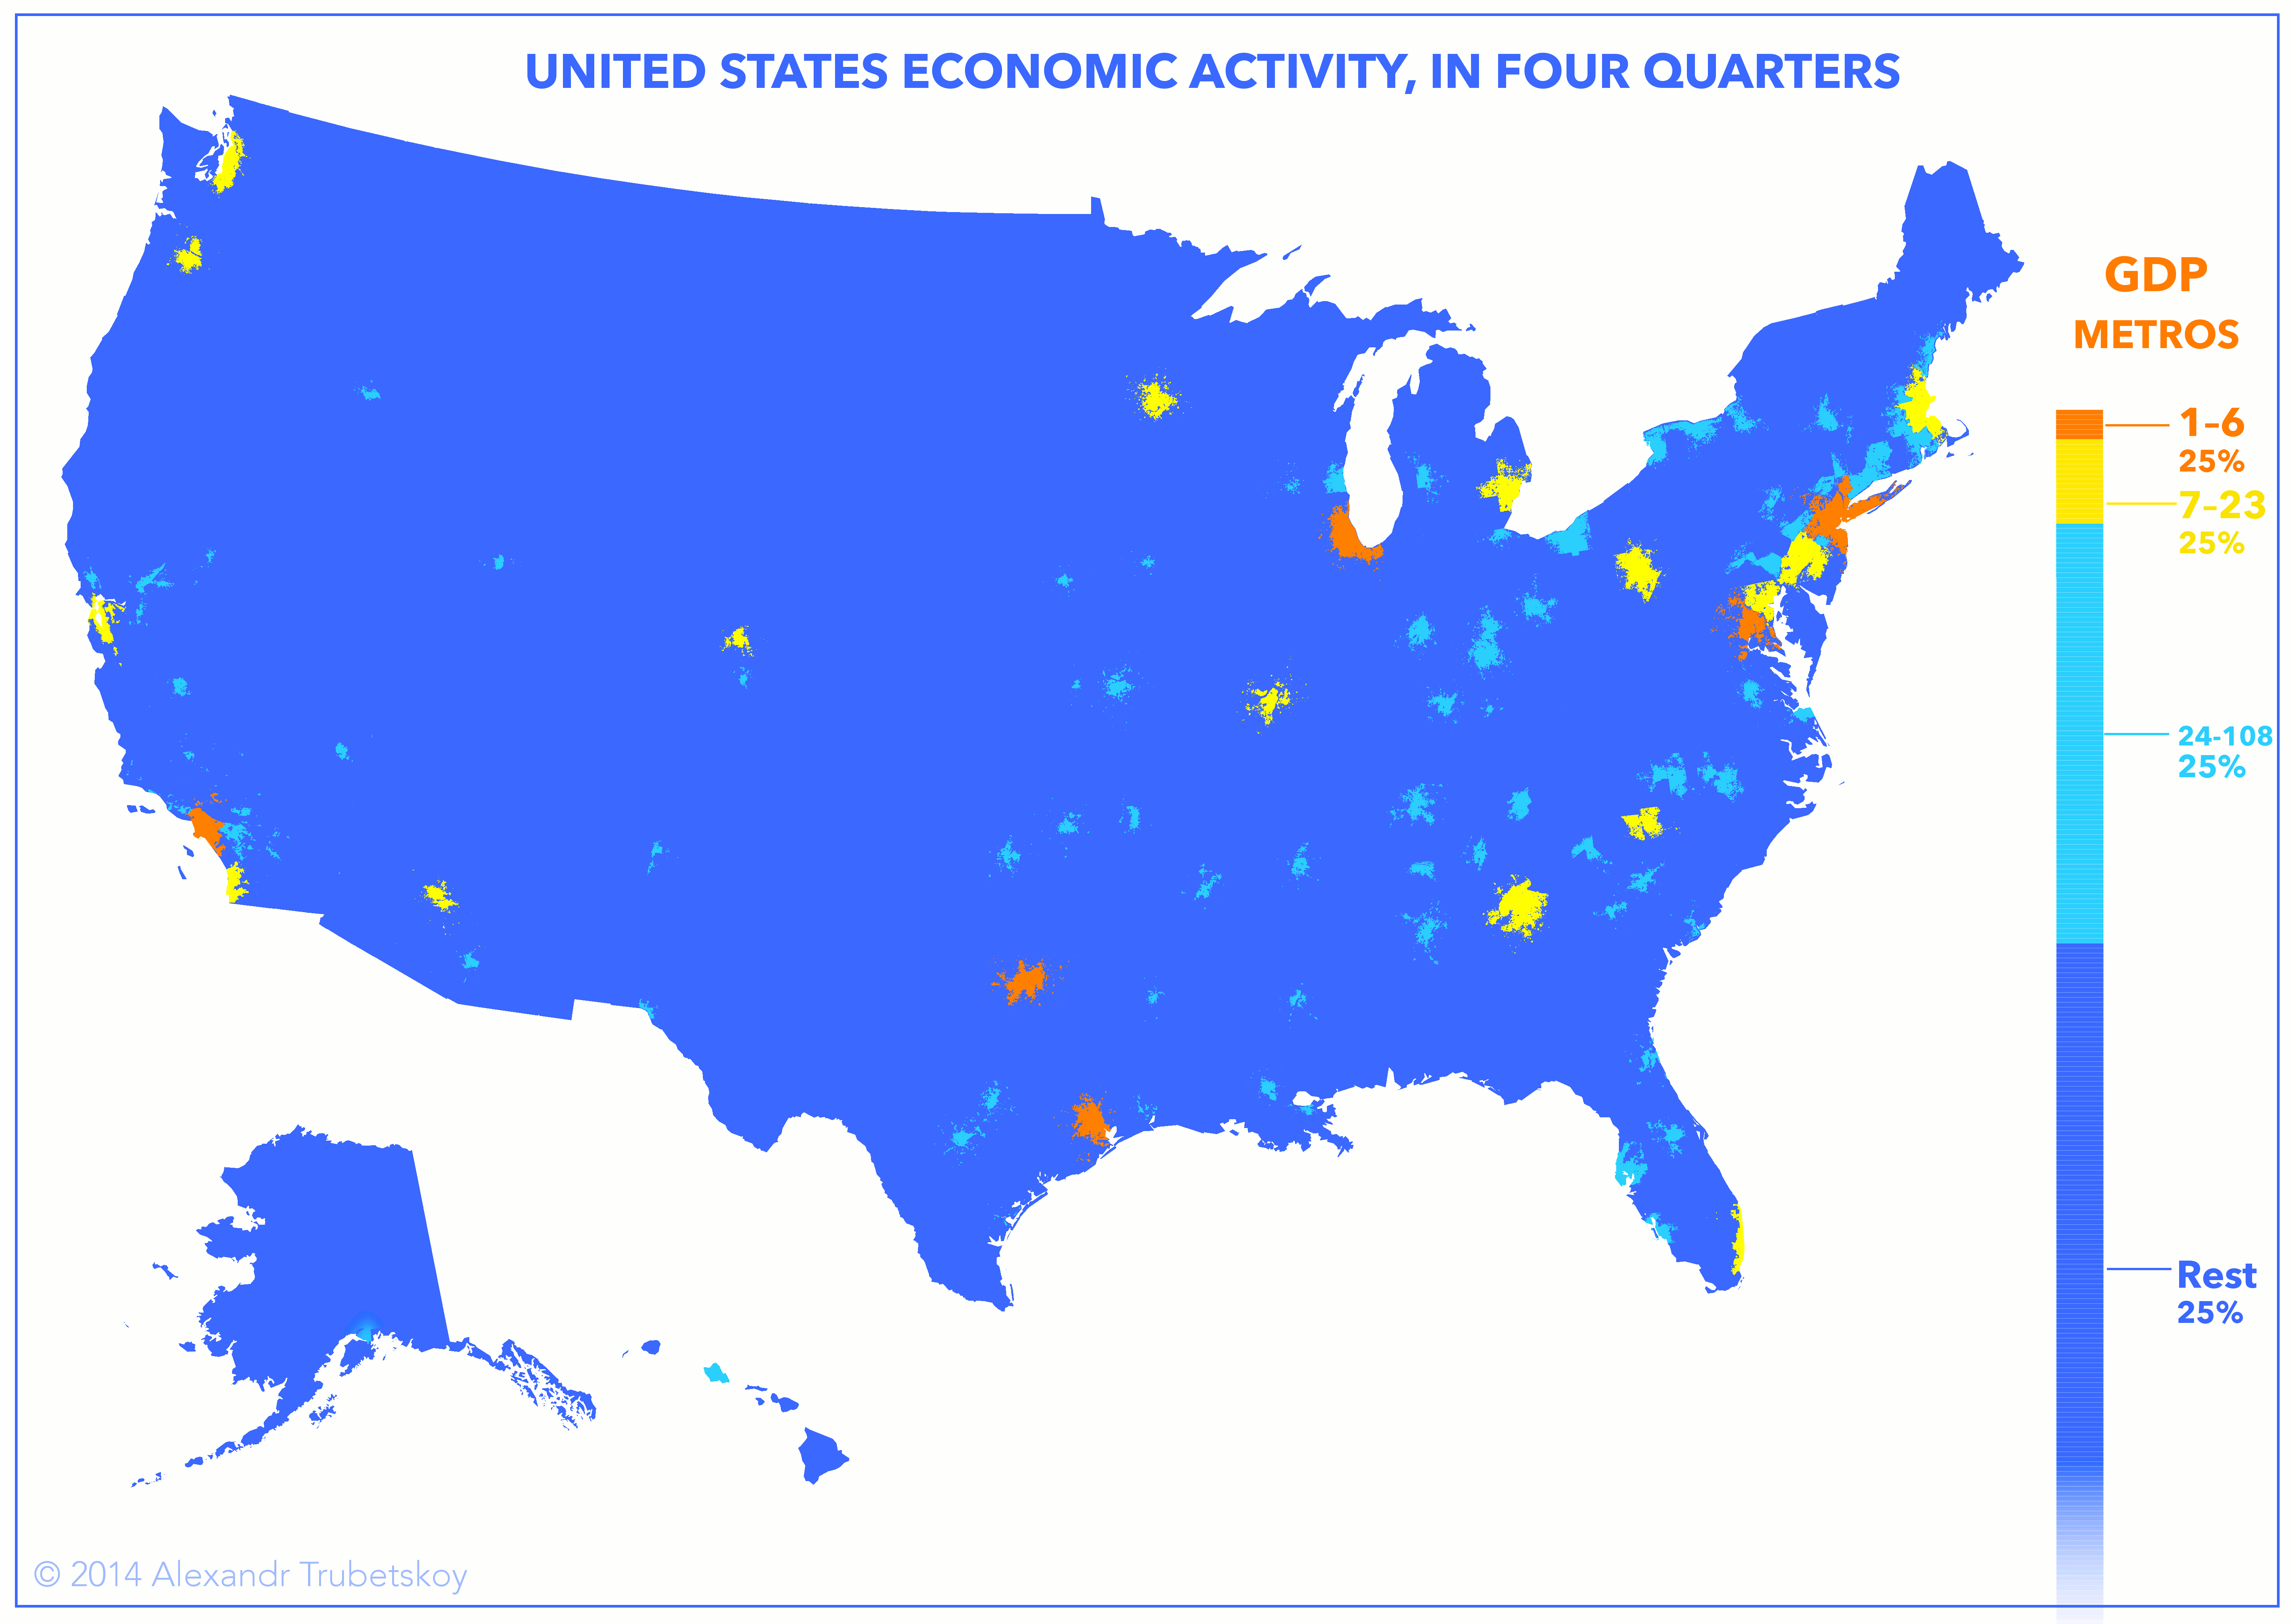
US Economic Activity in Four Quarters
Posted on 20 February, 2014 at 9:00 PM
Each colored area has approximately the same gross domestic product (GDP).
This would equate to $8.10 trillion for each colored half in the top map, and $4.05 trillion for each colored quarter in the bottom map.
This map was made using 2013 data from a U.S. Conference of Mayors report, prepared by IHS Global Insight.
This map addresses criticism of my previous one that I had taken artistic liberties in swapping around cities and states, making the methodology inconsistent. This map no longer arbitrarily swaps any areas, instead simply ranking the metropolitan areas in order by their GDP.
The top 6 metro areas (New York, Los Angeles, Chicago, Washington, Houston, Dallas; in order) create a quarter of the GDP, while the top 23 metro areas are responsible for half of the country's economy.
Related Projects